Load and Explore a Mission from Database
Load a Mission
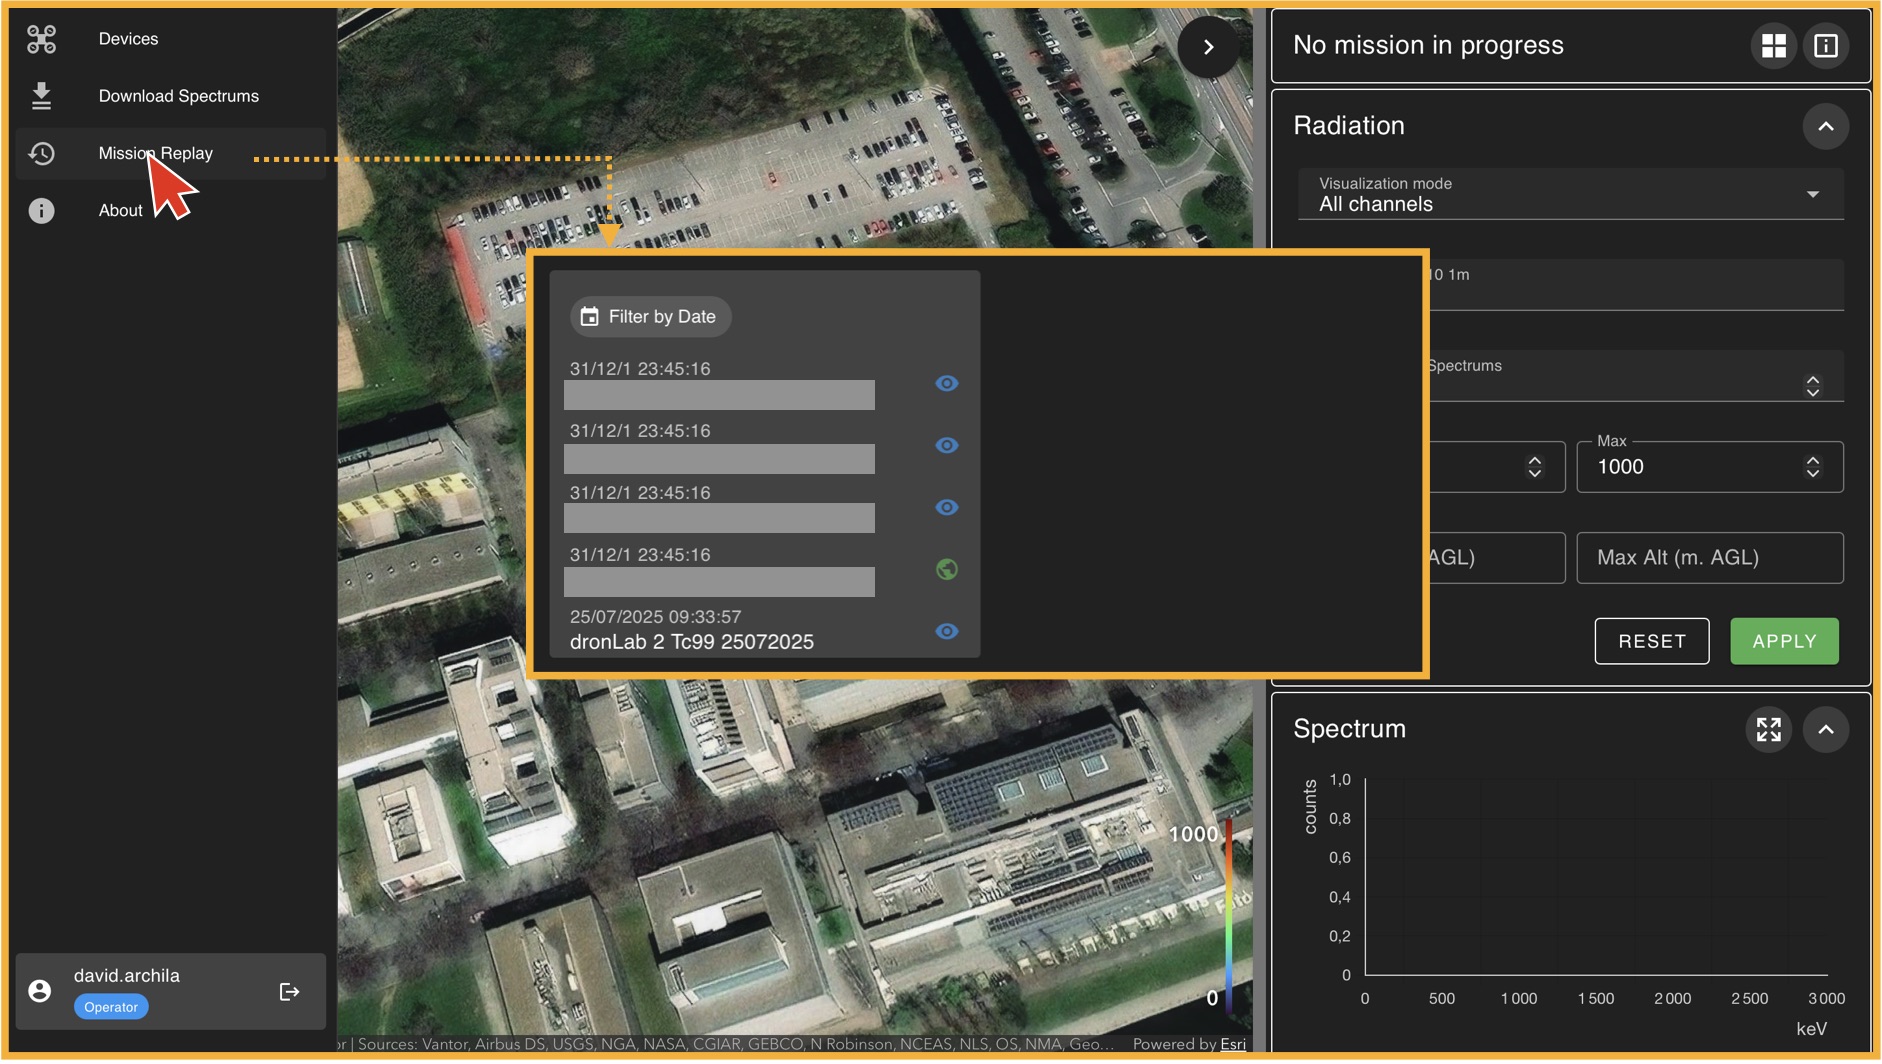
To load a mission, go to the left panel (Panel A) and click on "Mission Replay". This will take you to the "Mission Player" environment, where the first thing you must do is select a mission from the available database. In general, there will always be one mission available for training purposes. If no mission is available, please contact your administrator. Once you select a mission from the list, click on "Load Mission".
The Mission Replay Environment
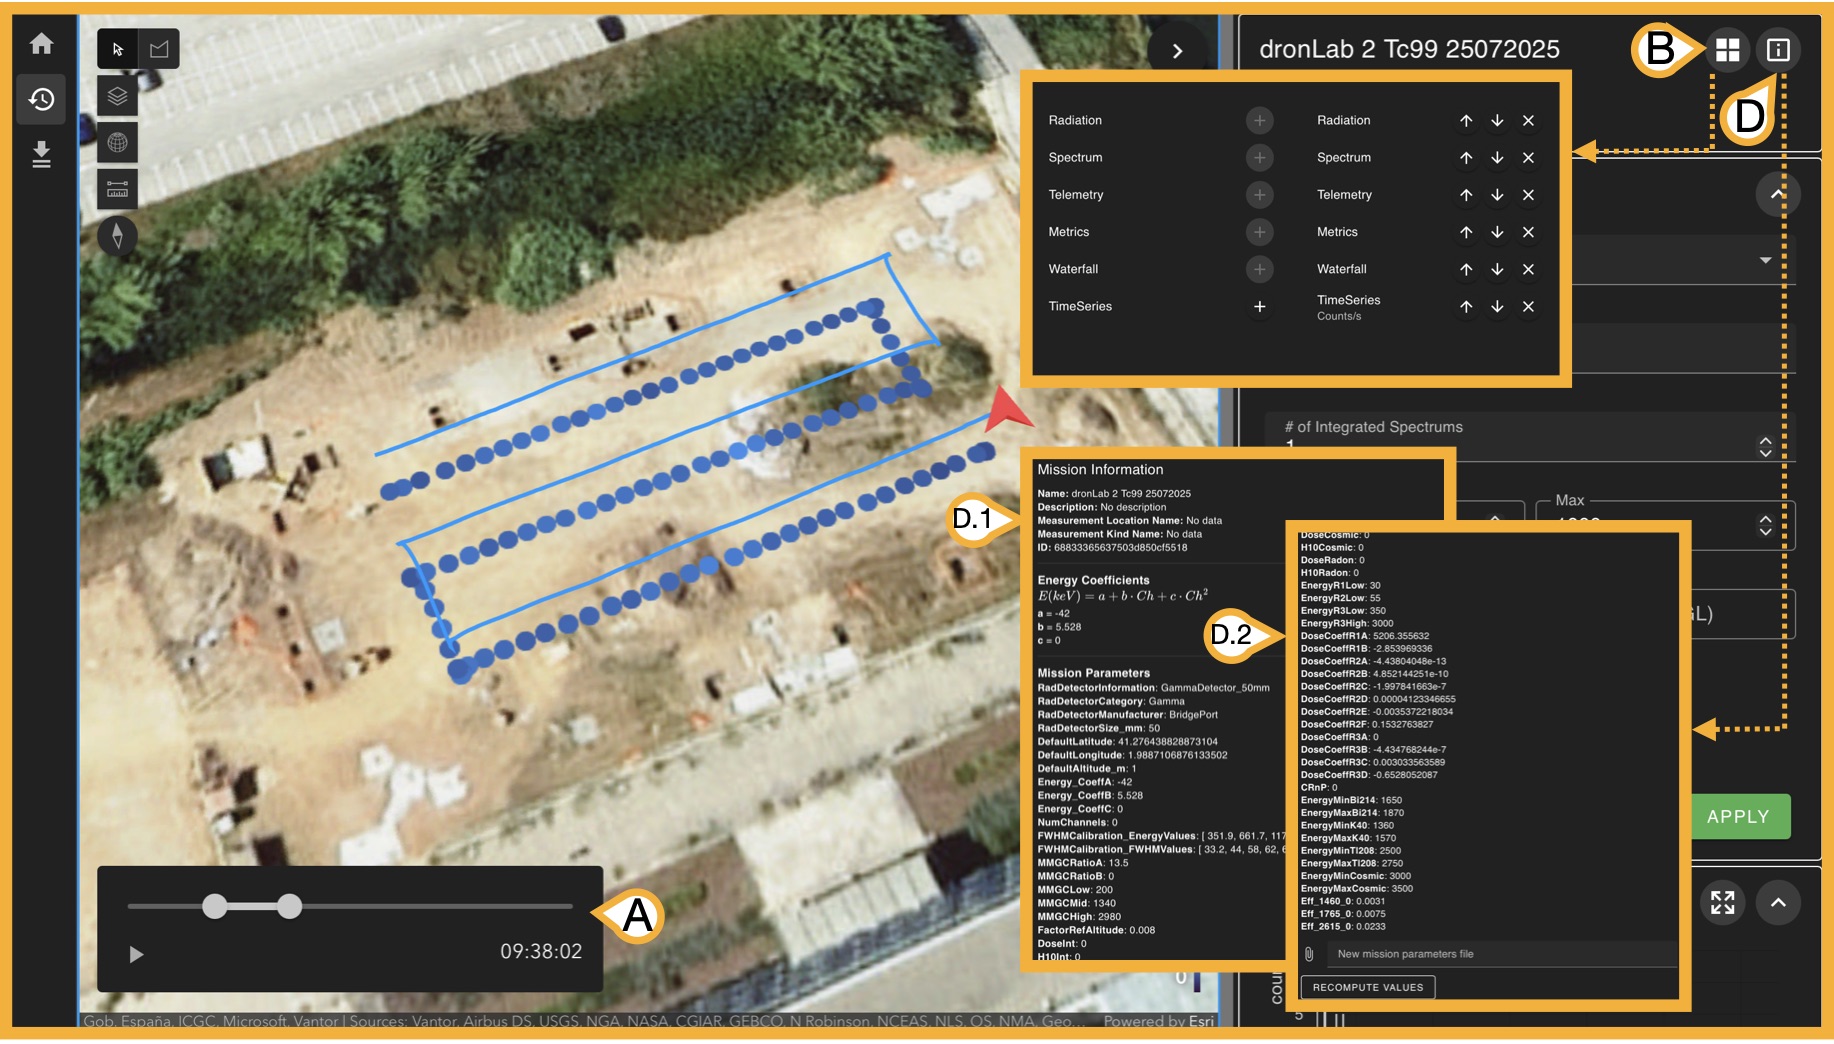
Once a mission is loaded, the right panel (Panel C) now displays all information available from the measurement done, there are 3 key bottons before exploring this informaton.
- (A) Time selector: Given mission measurements have time-stamps, this slider allows you to select a start time and an end time of the measurments you want to analyse from the original measurment. This step is key as the 6 following panels will show information only related with the selected time-stamp.
-
(B) Sub-panel Organizer: Panel C has 6 types of subpanels:
- Radiation
- Spectrum
- Telemetry
- Metrics
- Waterfal
- Time Series
- (D) Mission Information: This botton opens a (D.1) scrollable window with the mission parameters that are used to perform internal calculations, these paremeteres are uploaded when creating the mission but can be also (D.2) updated in case its needed if you scroll to the end. We will disscuss this paramerest when we talk about creating yout own mission.
Now we will explore the use of each subpanel.
Radiation
Selecting channels to display on map
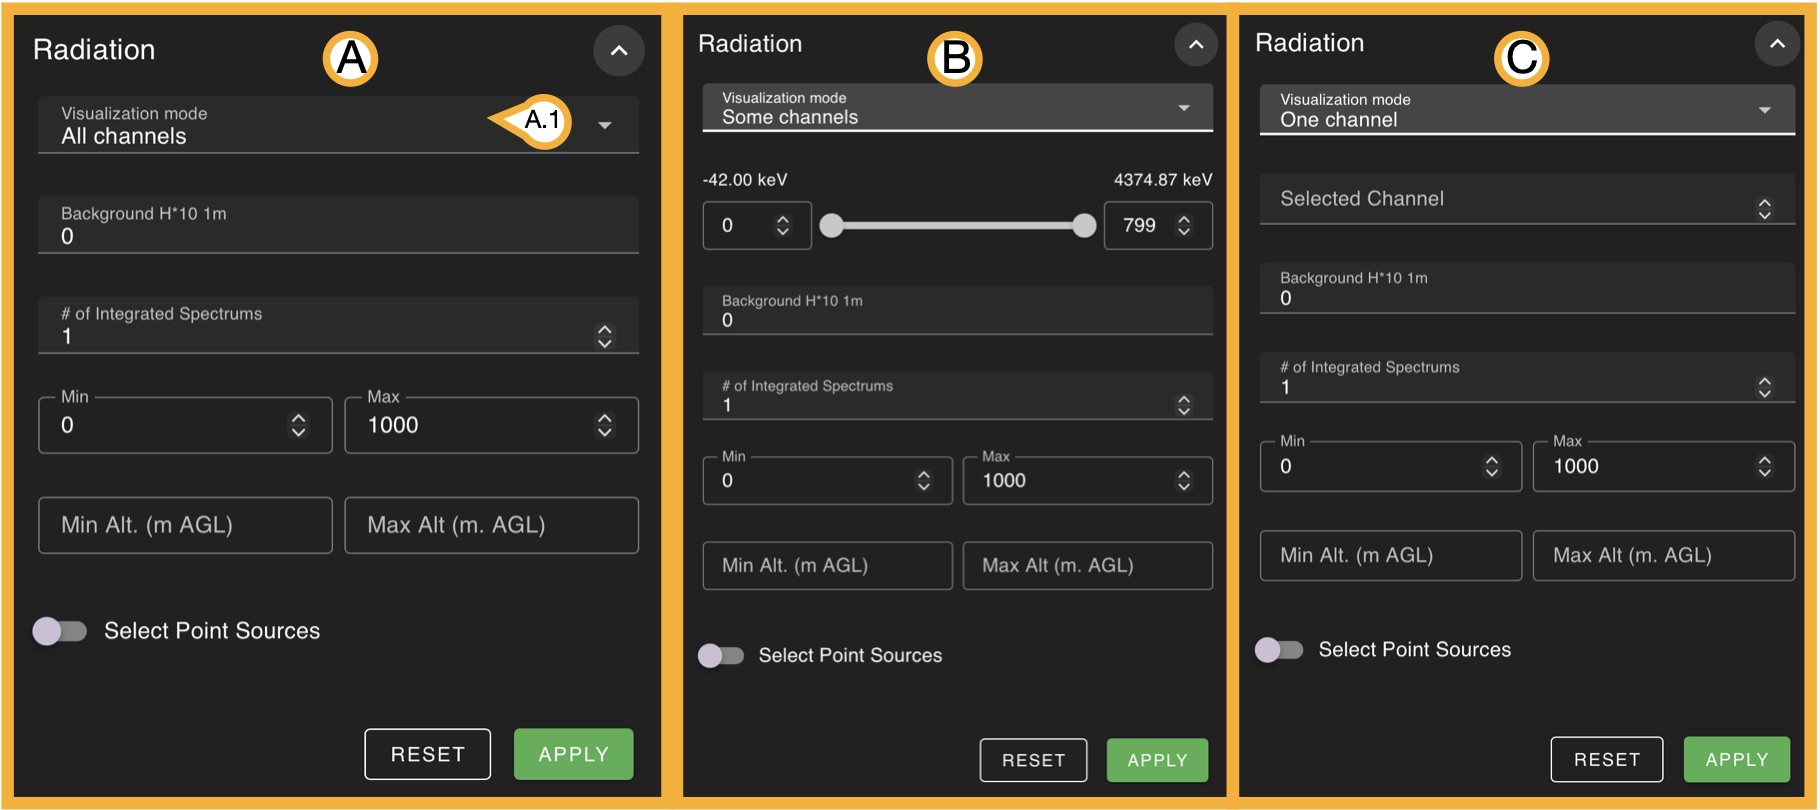
In the panel (A.1) visualization mode menu, you can select various types of measurements to display, from this list you can pick:
- All channels
-
(B) Some channels
(C) One channel
- Dose Rate
- H*10
- H*10 at 1m
- Continous H*10 Mapping (clicking "Apply" is requiered)
- Discrete H*10 Mapping (clicking "Apply" is requiered)
- MMGC (Man-Made Gross Count)
- Bi-214 concentration
- K-40 concentration
- Tl-208 concentration
It is important to recall that a channel refers to an energy interval in which incident gamma rays are recorded as counts. For this reason, options (B) and (C) behave differently. In (B), the user can select a channel interval (with the corresponding energy range displayed), which effectively selects a range of energies for which the detected counts are shown. In contrast, (C) allows the selection of only a single channel, corresponding to a very narrow energy interval.
Note that for any selection of the visualization mode you have invariable 4 options, the first 3 requiere to click on "Apply" to see changes on map:
- # of integrated spectra: As spectra are recorded every n seconds, they can be integrated (summed) to reduce the total number of data points. This process is equivalent to adding consecutive measurements together. Internally, the software adds every n measurements into a single spectrum, effectively reducing the number of points while preserving the overall spectral information.
- Min/Max :Allows you to select the minimum and maximum values for the selected measurement type.
- Min/Max Alt. (m AGL): Allows you to select the minimum and maximum drone altitude (above ground level) in meters values for the selected measurement type.
- Select Point Sources: If you know the exact location of the sources, use this option to manually define their positions on the map. Activate this option, then click on the map to place each source whose location you know. Once all point sources are placed, click Apply. After the point sources are configured on the map, you can enable the Continuous H*10 Mapping and Discrete H*10 Mapping options.
Clicking on "Reset" always gets you back to initial values for all selections.