Load and Explore a Mission from Database
Load a Mission
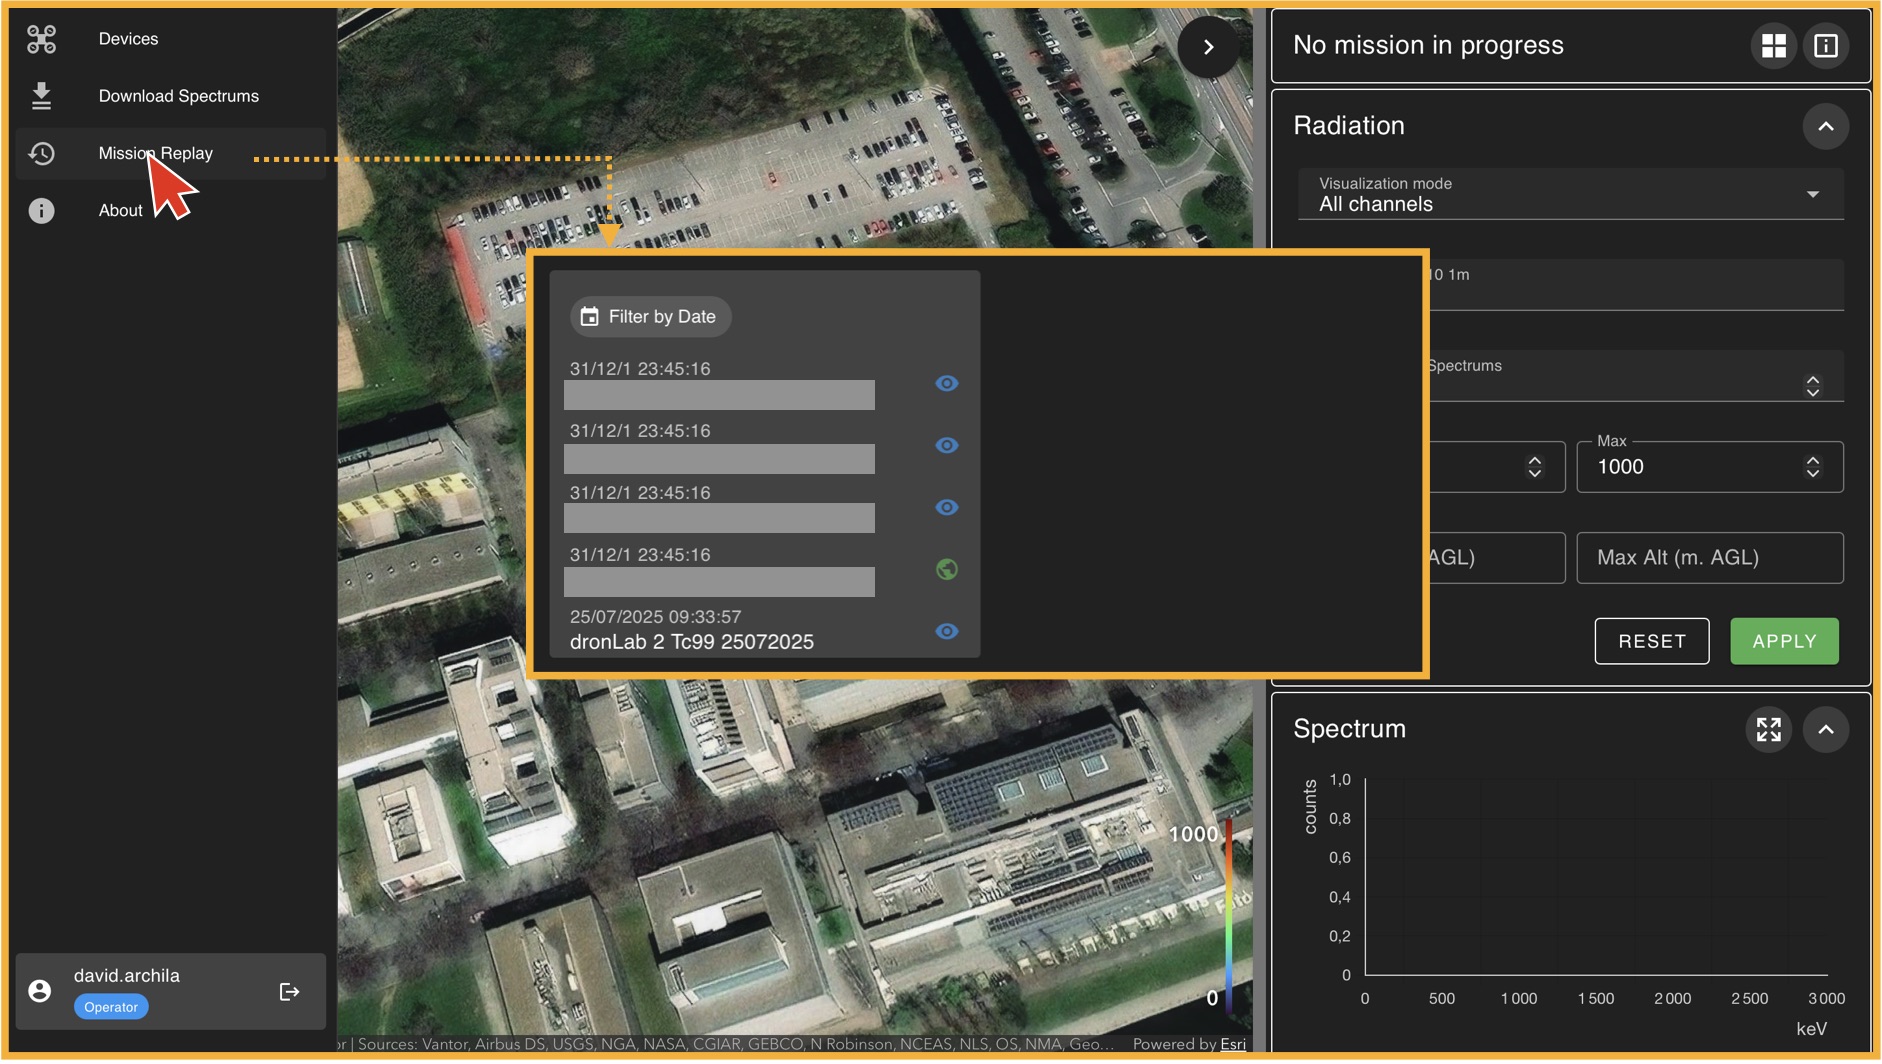
To load a mission, go to the left panel (Panel A) and click on "Mission Replay". This will take you to the "Mission Player" environment, where the first thing you must do is select a mission from the available database. In general, there will always be one mission available for training purposes. If no mission is available, please contact your administrator. Once you select a mission from the list, click on "Load Mission".
The Mission Replay Environment
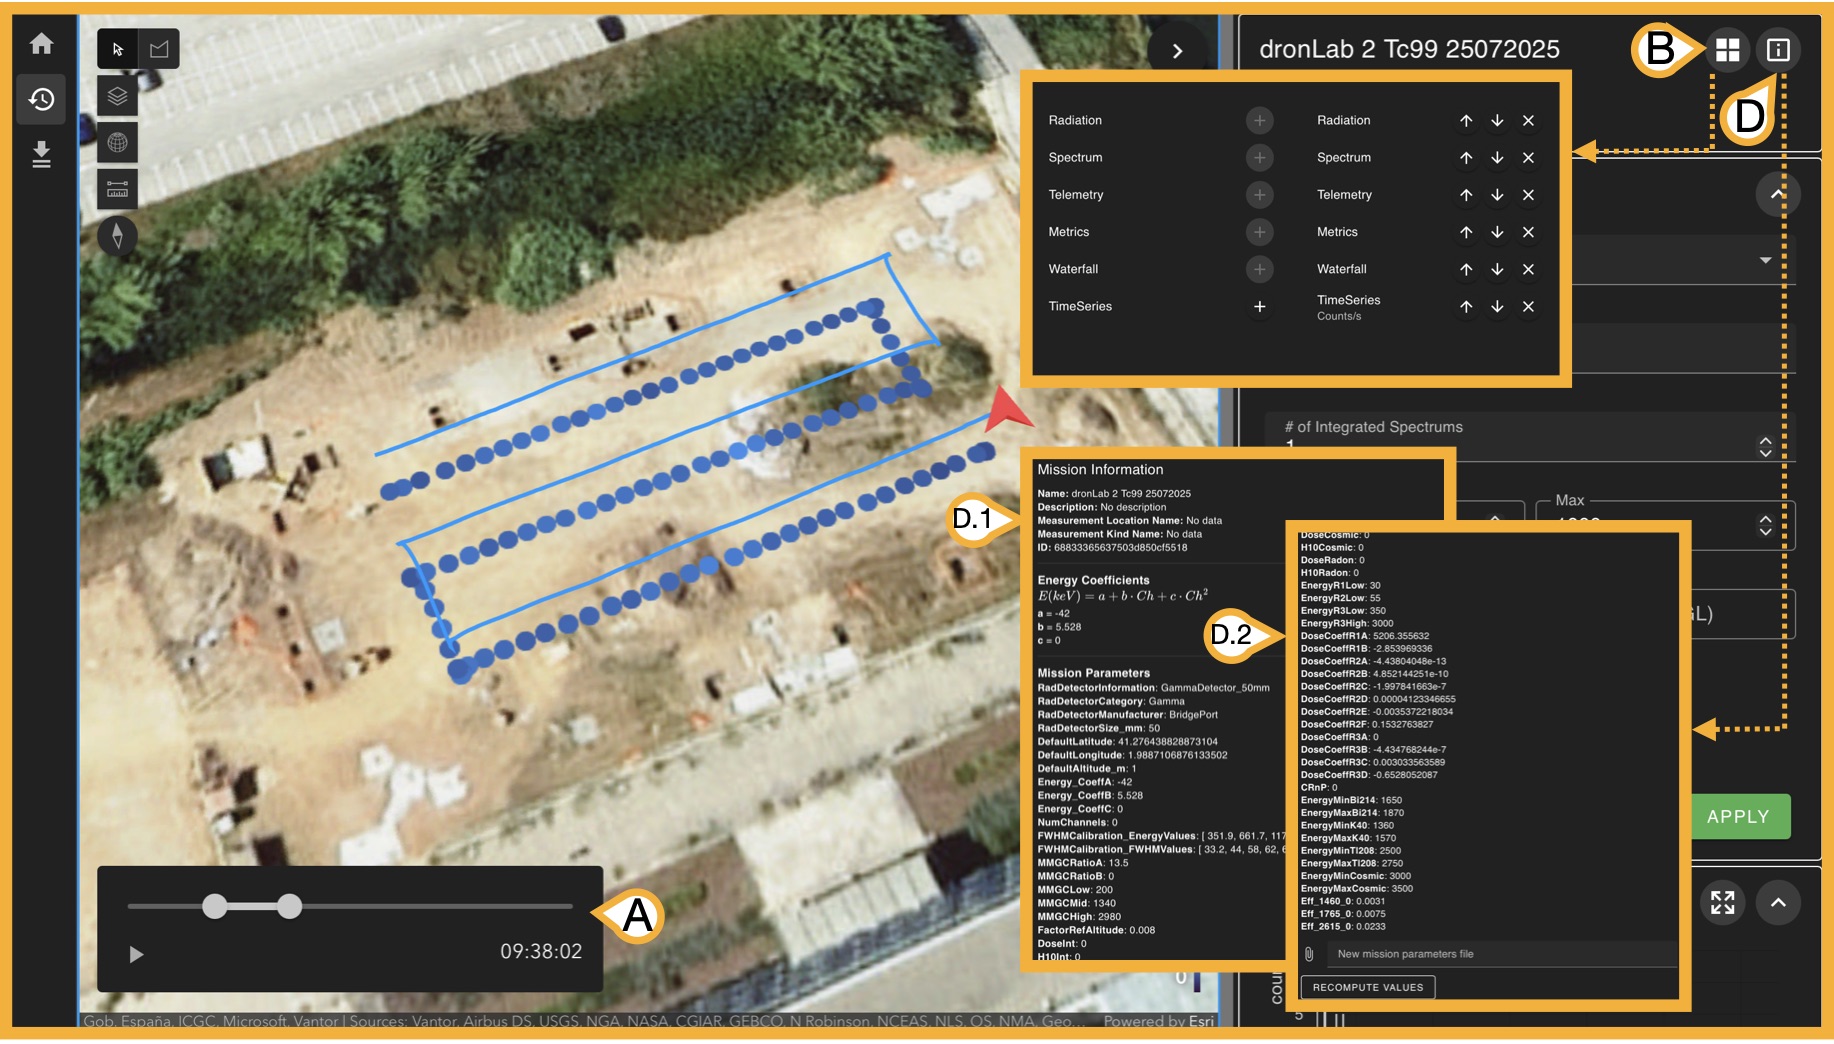
Once a mission is loaded, the right panel (Panel C) now displays all information available from the measurement done, there are 3 key bottons before exploring this informaton.
- (A) Time selector: Given mission measurements have time-stamps, this slider allows you to select a start time and an end time of the measurments you want to analyse from the original measurment. This step is key as the 6 following panels will show information only related with the selected time-stamp.
-
(B) Sub-panel Organizer: Panel C has 6 types of subpanels:
- Radiation
- Spectrum
- Telemetry
- Metrics
- Waterfal
- Time Series
- (D) Mission Information: This botton opens a (D.1) scrollable window with the mission parameters that are used to perform internal calculations, these paremeteres are uploaded when creating the mission but can be also (D.2) updated in case its needed if you scroll to the end. We will disscuss this paramerest when we talk about creating yout own mission.
Now we will explore the use of each subpanel.
Radiation
Selecting channels to display on map
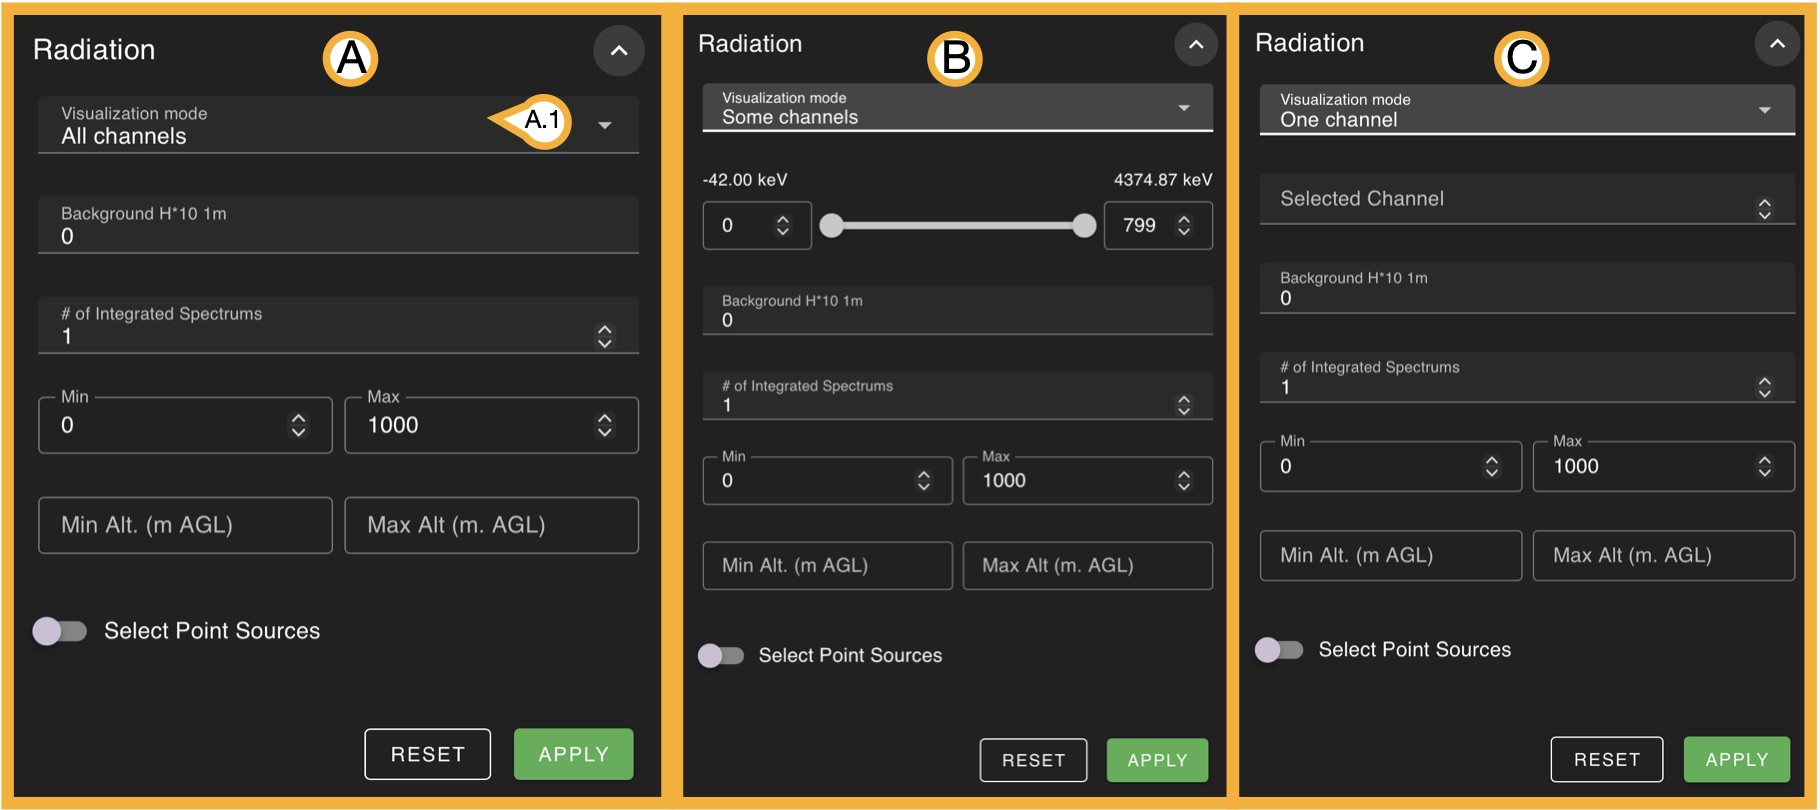
In the panel (A.1) visualization mode menu, you can select various types of measurements to display, from this list you can pick:
- All channels
-
(B) Some channels
(C) One channel
- Dose Rate
- H*10
- H*10 at 1m
- Continous H*10 Mapping (clicking "Apply" is requiered)
- Discrete H*10 Mapping (clicking "Apply" is requiered)
- MMGC (Man-Made Gross Count)
- Bi-214 concentration
- K-40 concentration
- Tl-208 concentration
It is important to recall that a channel refers to an energy interval in which incident gamma rays are recorded as counts. For this reason, options (B) and (C) behave differently. In (B), the user can select a channel interval (with the corresponding energy range displayed), which effectively selects a range of energies for which the detected counts are shown. In contrast, (C) allows the selection of only a single channel, corresponding to a very narrow energy interval.
Note that for any selection of the visualization mode you have invariable 4 options, the first 3 requiere to click on "Apply" to see changes on map:
- # of integrated spectra: As spectra are recorded every n seconds, they can be integrated (summed) to reduce the total number of data points. This process is equivalent to adding consecutive measurements together. Internally, the software adds every n measurements into a single spectrum, effectively reducing the number of points while preserving the overall spectral information.
- Min/Max :Allows you to select the minimum and maximum values for the selected measurement type.
- Min/Max Alt. (m AGL): Allows you to select the minimum and maximum drone altitude (above ground level) in meters values for the selected measurement type.
- Select Point Sources: If you know the exact location of the sources, use this option to manually define their positions on the map. Activate this option, then click on the map to place each source whose location you know. Once all point sources are placed, click Apply. After the point sources are configured on the map, you can enable the Continuous H*10 Mapping and Discrete H*10 Mapping options.
Clicking on "Reset" always gets you back to initial values for all selections.
Spectrum
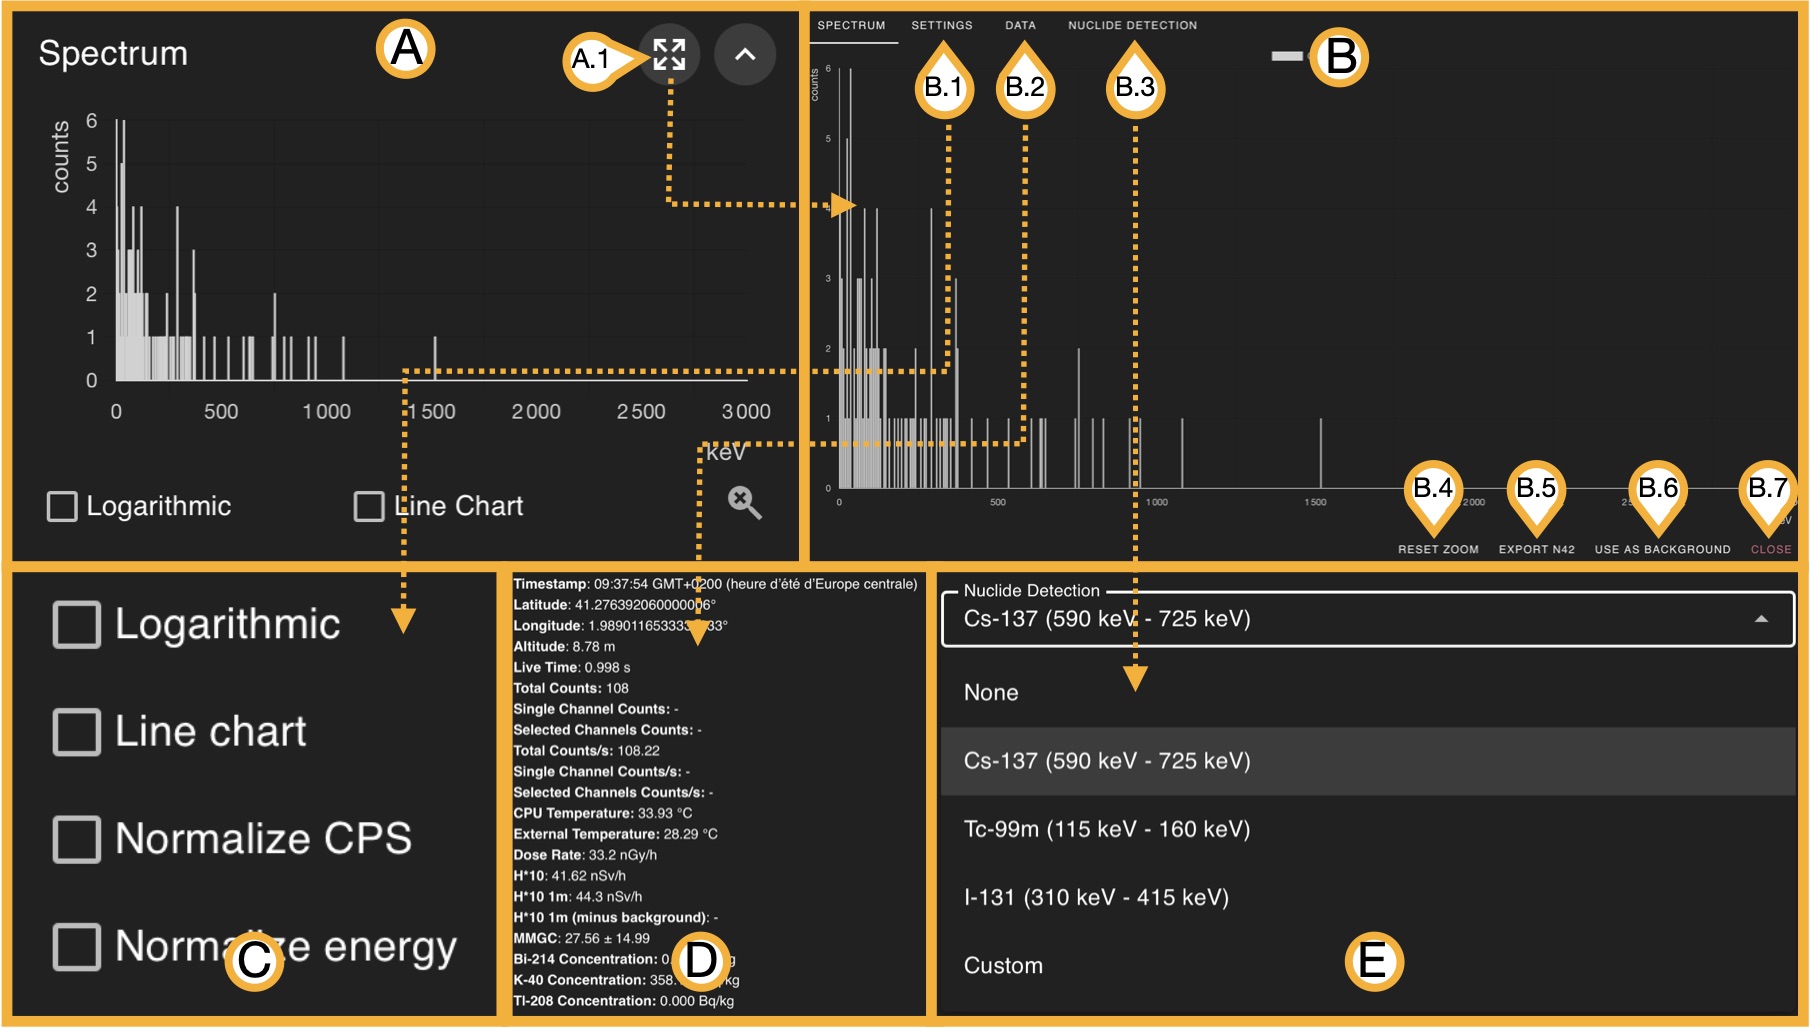
The (A) original sub-panel displays only the summed spectra of the selected data for the chosen time stamp, in this view, you can zoom in using the mouse wheel and reset the zoom by clicking the magnifying glass icon in the bottom-right corner. You can switch between a logarithmic scale and a line chart view. However, by clicking on (A.1), the (B) window is displayed. The (B) window shows the same spectral information but provides additional analysis options. By selecting a region of the spectrum, you can zoom into that area; the (B.4) button resets the zoom to the full spectrum view.
The (B.1) option opens the display settings (C) menu. After applying any changes, always return to "Spectrum" to visualize the updated configuration.The (B.2) option opens a winddow (D) that displays general mean and summed data of the combined spectrum.The (B.3) option is a (E) photopeak analysis tool that helps identify whether a specific radionuclide may be present in the measurements. For reliable results, the detector energy calibration must be accurate.
The (B.5) option allows you to download all data from the selected spectra as .N42 files. The (B.6) option allows you to set the current spectrum as a "background spectrum", which can then be used as a reference for other measurements. The (B.7) option closes the window, producing the same effect as clicking outside of it.
Telemetry
We will see this panel in detail in Create My Own Mission section.
Metrics
We will see this panel in detail in Create My Own Mission section.
Waterfal
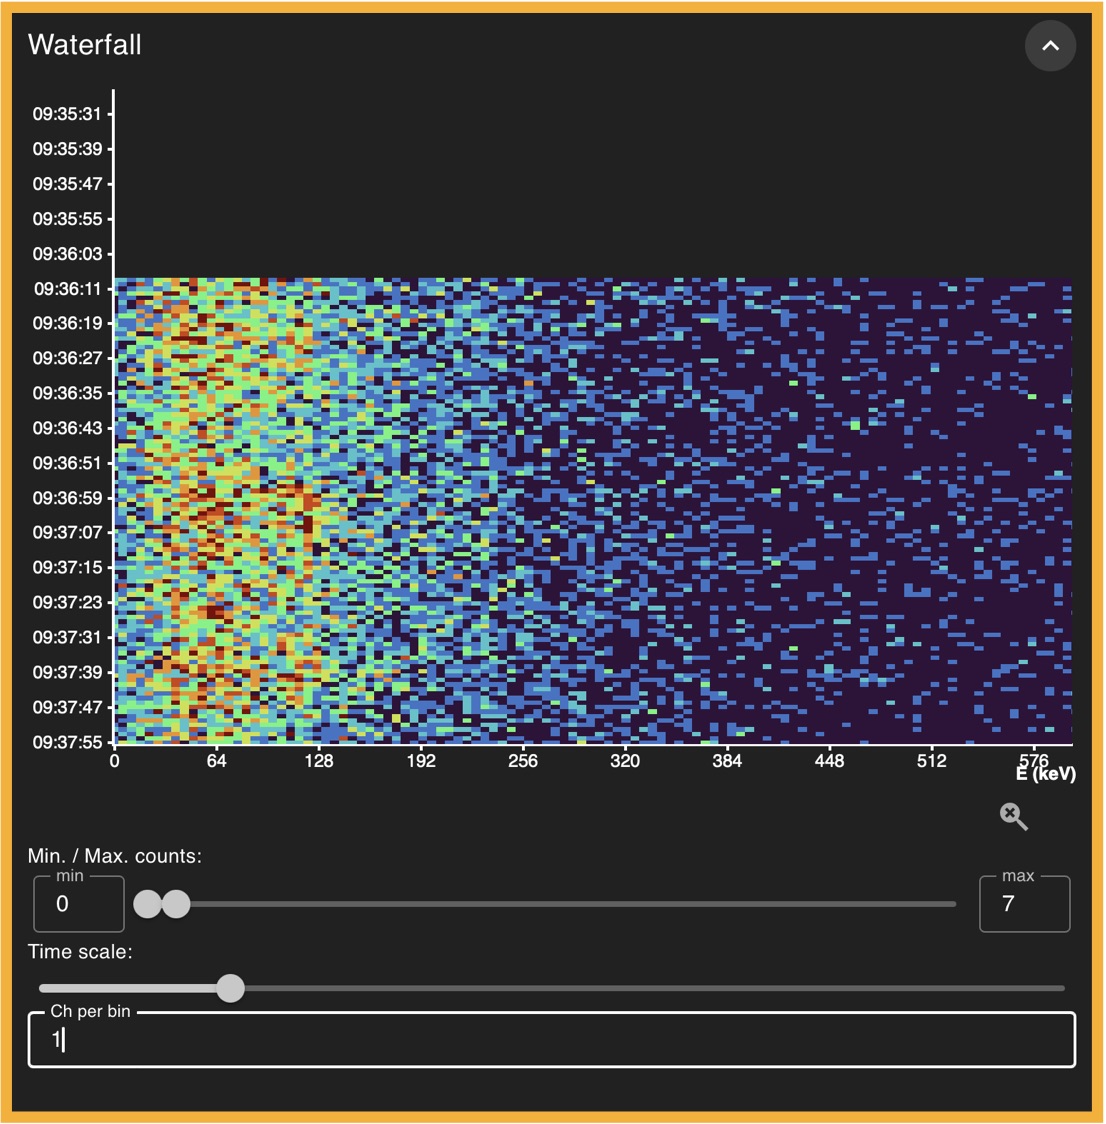
This sub-panel provides detailed information for the selected spectra, displaying each spectrum individually along with the time at which it was recorded, instead of summing them together as the "Spectrum" sub-panel does. In this view, you can zoom in using the mouse wheel and reset the zoom by clicking the magnifying glass icon in the bottom-right corner. You can adjust the minimum and maximum count values of the color scale, and you can also group channels into bins, allowing each bin to represent a wider energy range.
Time Series
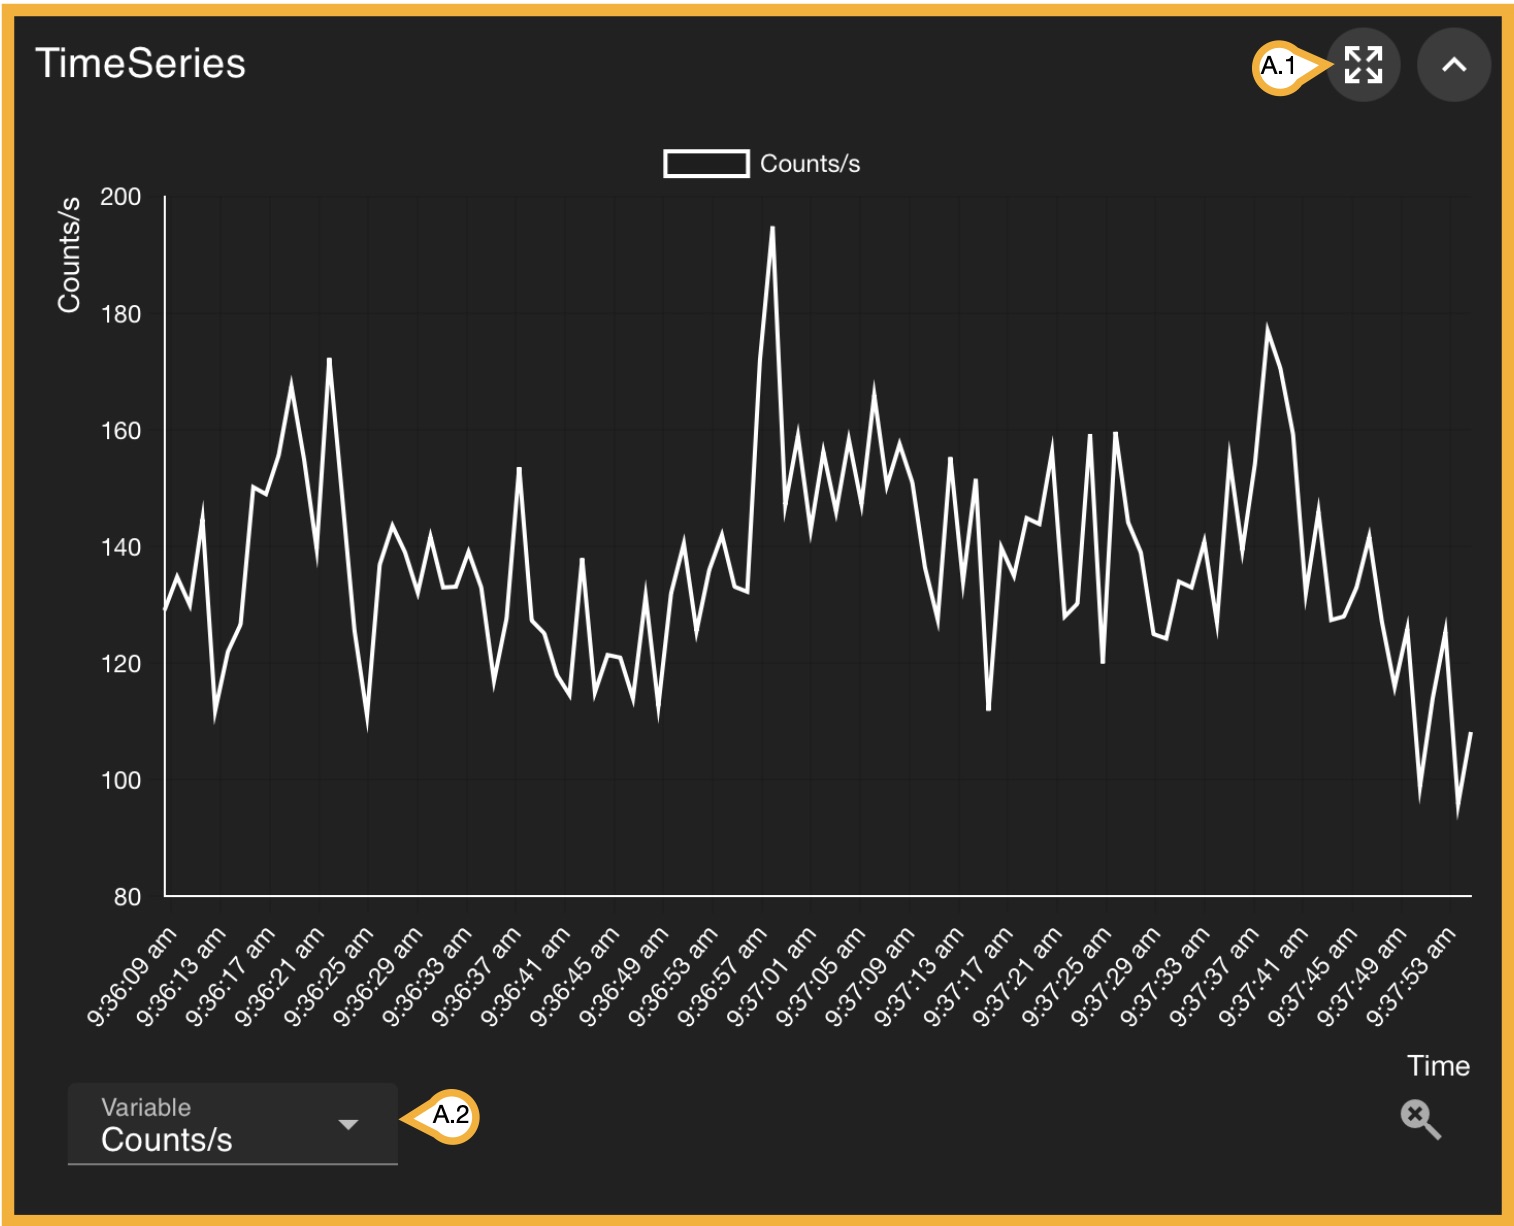
This sub-panel allows you to view a wide range of recorded parameters with time as x-axis, including both detection and device data.Clicking (A.1) opens this information in a larger window, while (A.2) lets you change the displayed parameter at will. In the sub-panel mode view, you can zoom in using the mouse wheel and reset the zoom by clicking the magnifying glass icon in the bottom-right corner. We will not explore each parameter but rather encourage you to do so.