Login and Main Environment
Login
Your profile permissions will depend on the GCS administrators. This guide is designed for the Operator role and can also provide support if you have a lower role.
To log in, go to https://gcs.rimaspec.upc.edu and enter the credentials provided by your administrator. Once logged in, we can explore the main environment.
Main Environment
After logging in, in the main environment you will find 3 main panels.
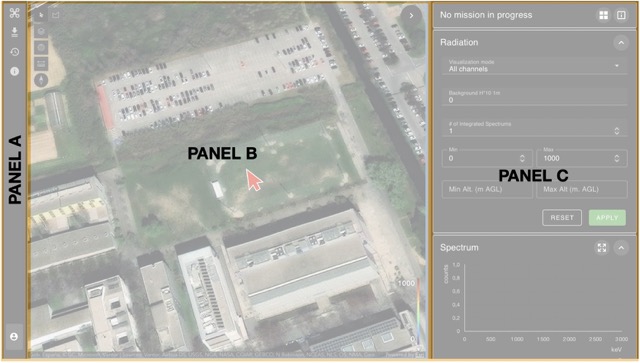
We will explore the panels one by one.
Panel A
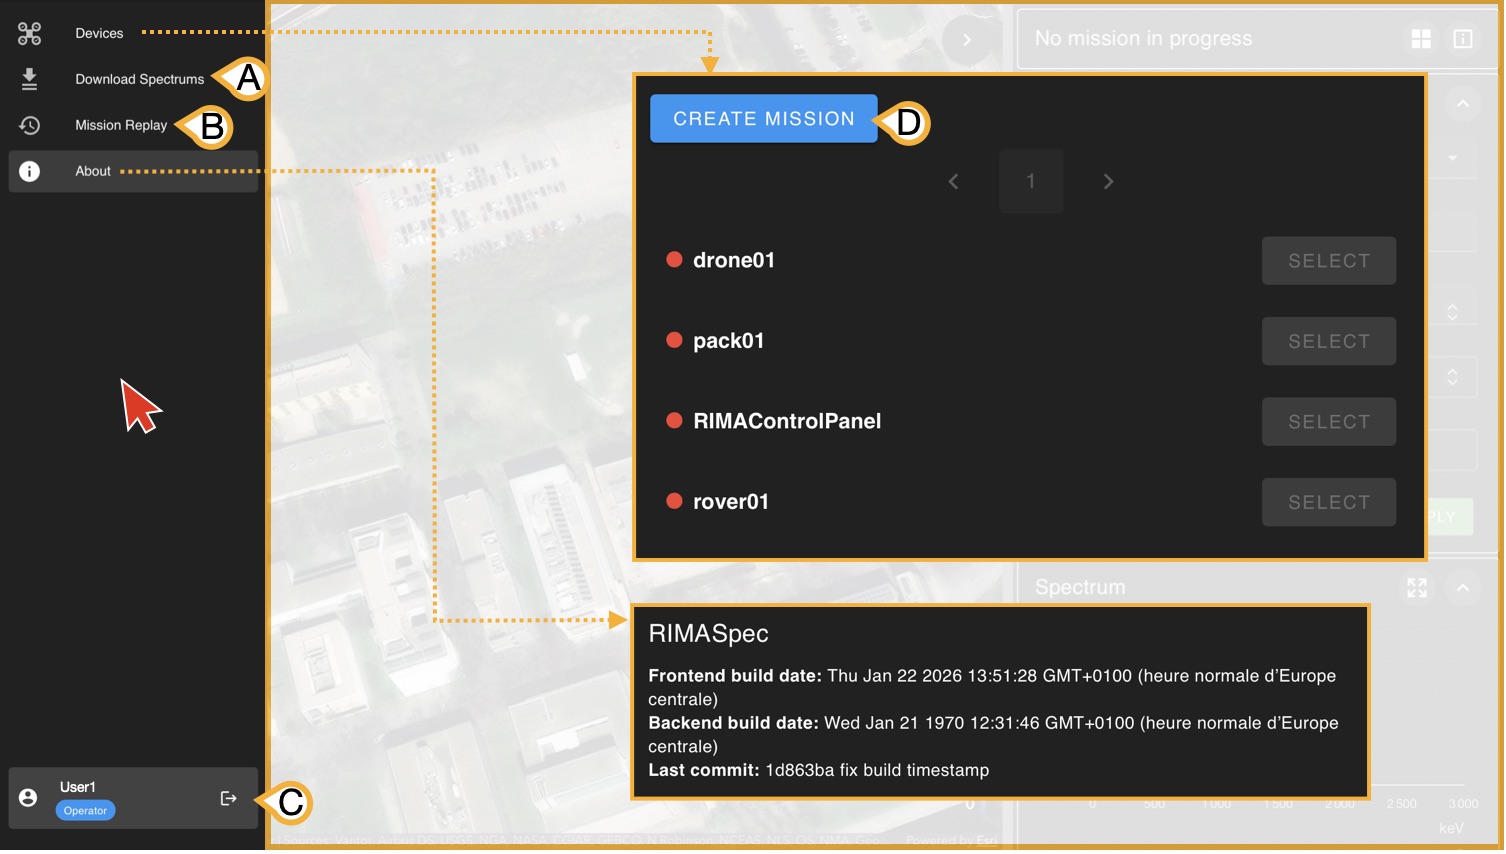
Panel A is displayed when hovering the cursor over it and contains 5 main buttons:
- Devices: Used to view connected devices and create (D) new missions.
- (A) Download Spectrums: Downloads spectrums if you have previously loaded a mission or have a mission currently running.
- (B) Mission Replay: Allows you to load a mission stored in the database.
- About: Used to view the current GCS version.
- (C) User Panel: Allows you to see the user you are logged in as and log out.
Panel B
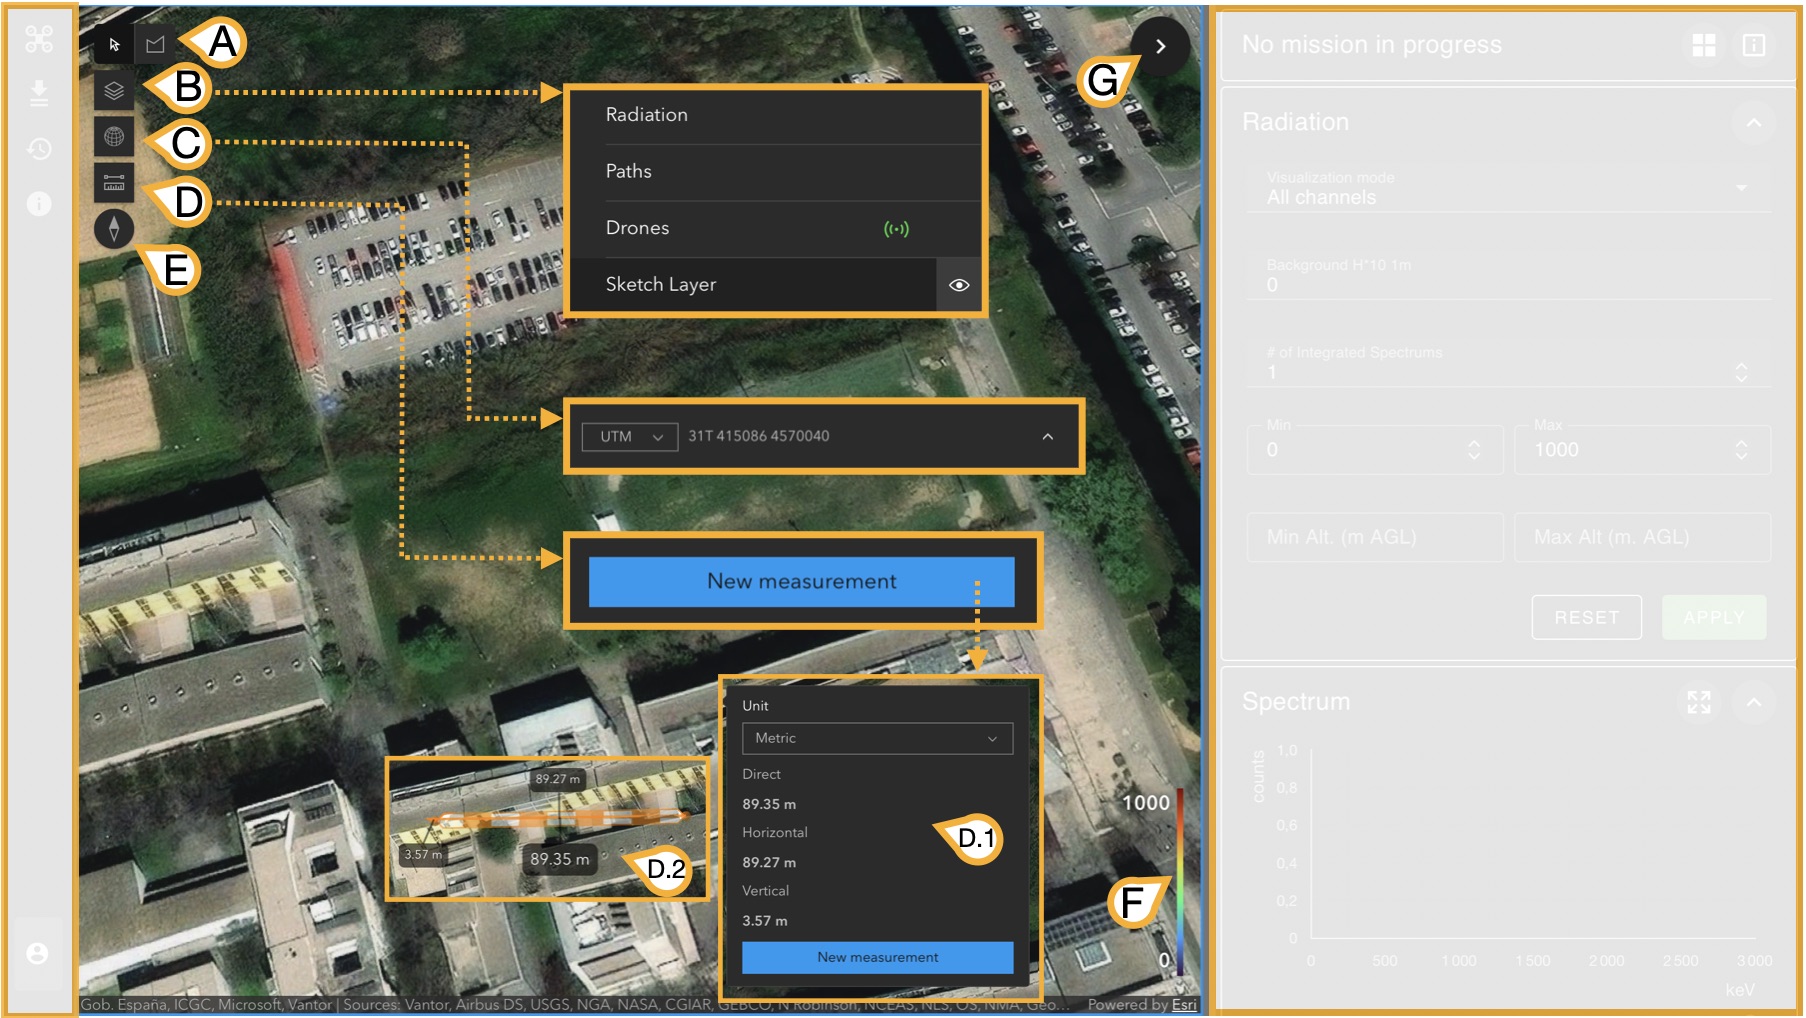
In this case, Panel B displays the startup map or the map of the current/loaded mission. Its buttons are mainly used to interact with the active map. It has 6 main buttons and a color scale:
- (A) Toggle between cursor and area selector: Allows switching between a standard cursor on the map and an area selector that lets you select measurement points in loaded missions or missions in progress.
- (B) Modify map layers: There are 4 available layers that can be hidden by clicking the eye icon.
- (C) View cursor coordinates: This allows you to see the coordinates of the current cursor in different coordinate systems, selecting your preferred one from the dropdown menu. In the image, for example, the dropdown menu is set to UTM.
-
(D) Measure distances: This tool allows you to measure distances between two points in different unit systems. To use this tool, click on "New Measurement", go to the map, and (D.2) click on two points on it. The (D.1) pop-up panel will show 3 distances:
- Direct: Euclidean distance between the two points considering terrain elevation.
- Horizontal: Euclidean distance between the two points without considering terrain elevation.
- Vertical: Euclidean difference between the two points in terms of elevation.
- (E) Orientator: When clicking this button, the map aligns with the north in case it has been manually rotated.
- (F) Scale: Some map layers will display colors; this represents the scale when field measurements are available.
- (G) Hide/Show Panel C: This button allows you to hide or show Panel C.
Panel C
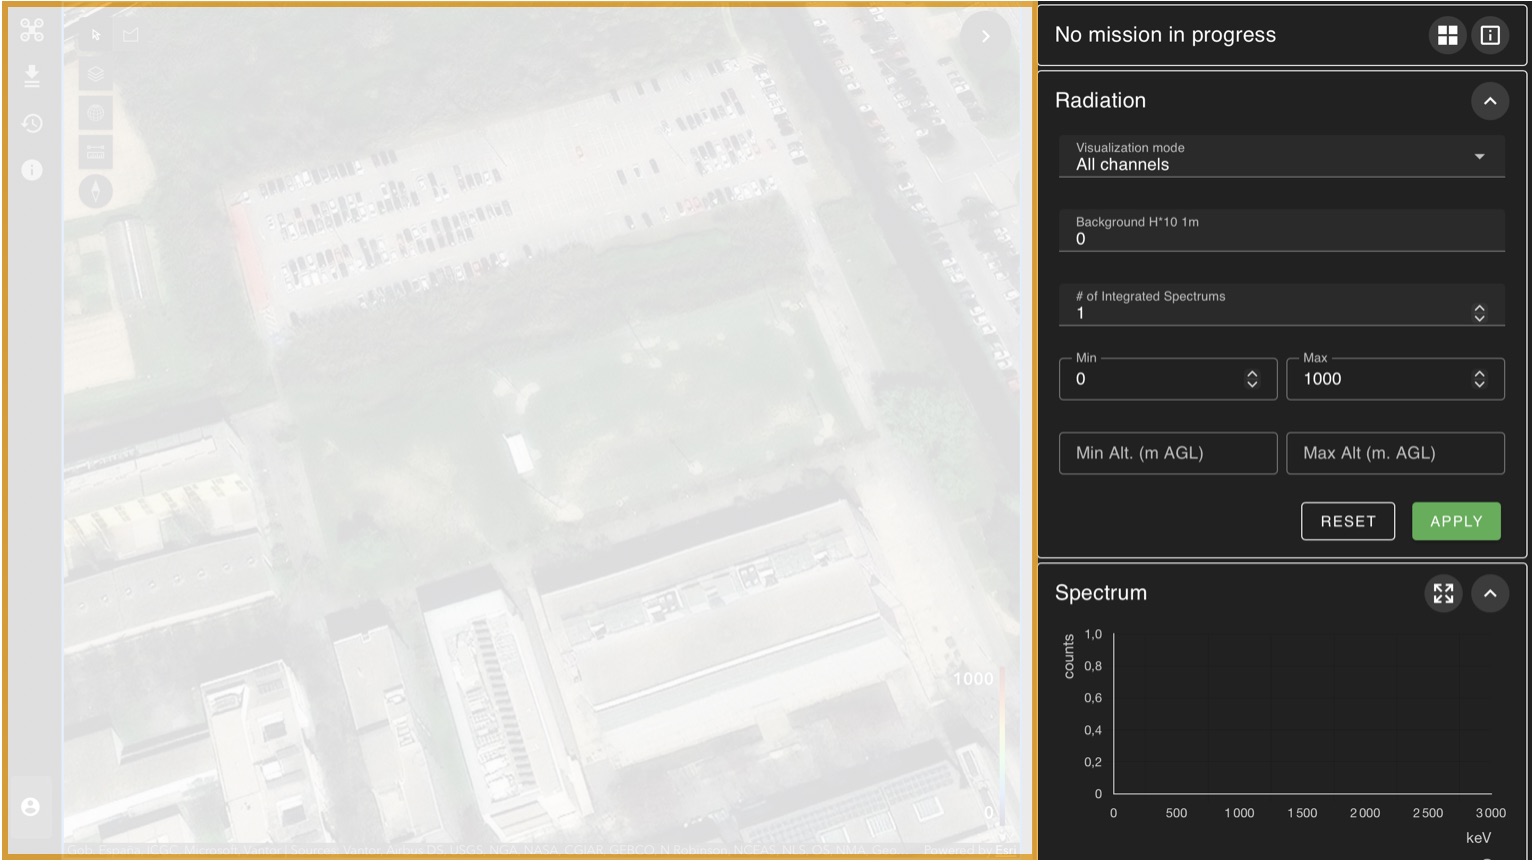
As you can see, Panel C contains all available information about the measurements taken over time by the detector. We will explore each subpanel in depth in the next section to understand its usage when real measurements are available.